Revenue & Margin
Many entrepreneurs find it difficult to quickly gain insight into the turnover and margin of delivered products and/or services. The data is often there, but analyzing and researching this data is complicated and time-consuming.
We built a data script to analyze and visualize revenue, margins and other relevant related KPIs from different angles.
Cash flow analysis
Cash is the lubricant for companies, yet not all entrepreneurs have insight into the cash flow. Investments are necessary for growth, but without insight into actual revenue flows, major expenses and current liabilities, any investment can be risky.
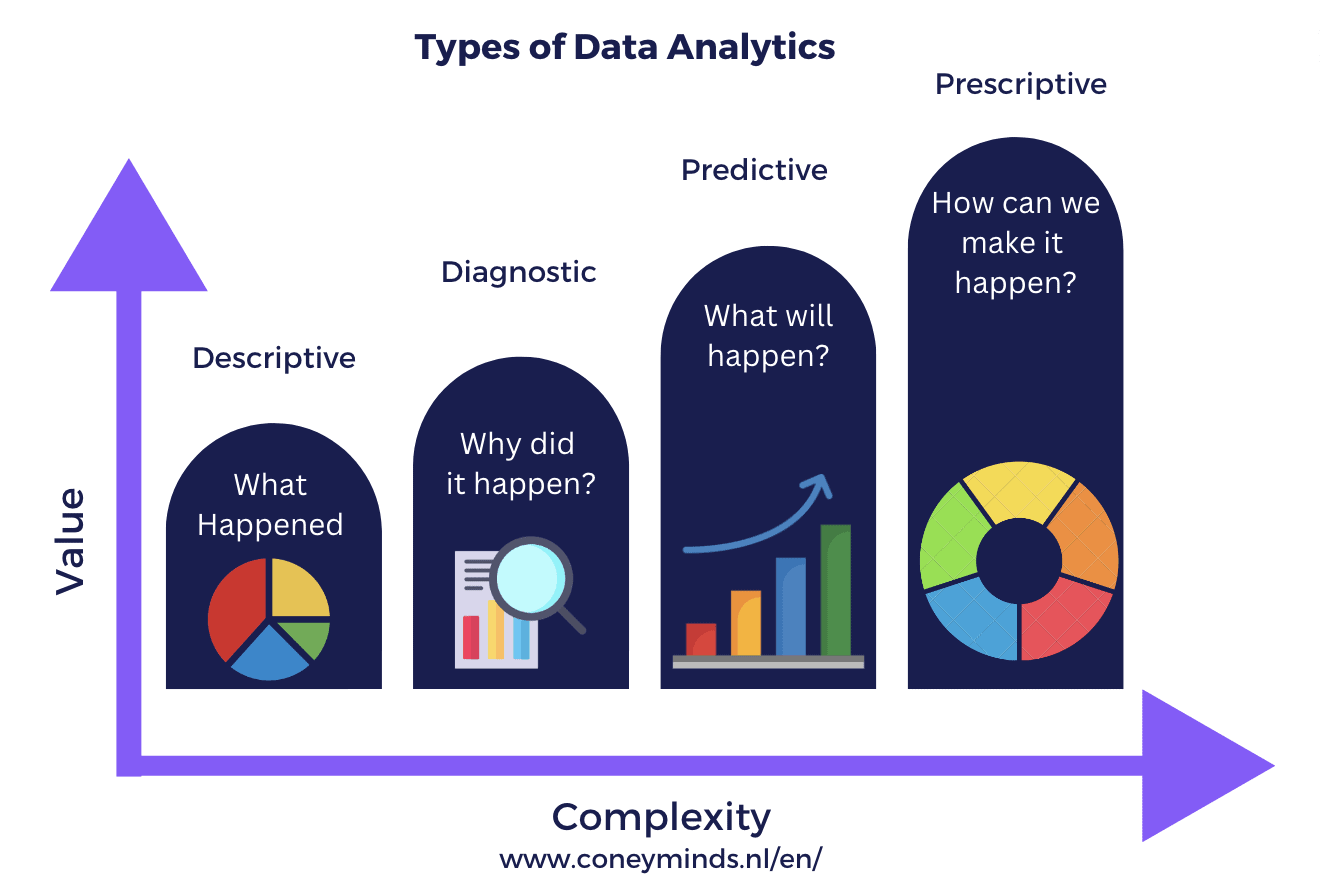
We build a data script, partly based on Predictive analytics techniques, to realize Cashflow Analytics for our clients.
Revenue Leaks
Unnoticed, companies are dealing with revenue leakage, despite the use of advanced ERP systems. Turnover that is wrongly not realized has a direct impact on the result and cash flow.
We build a data script from the thought of links between delivered products and services versus expected revenue billing. We quantify the turnover leakage and perform a cause analysis.
Sector Specific Analysis (API driven)
More and more software tools work with so-called APIs (application programming interface). We believe that entrepreneurs should always have access to their own data and should be able to convert data into “insights”.
The advent of “Software as a Service” means that you no longer manage data yourself. At Coney, we develop APIs adapters, so that you can access your own data and keep a grip on important business performance issues. We are also happy to build your API solution and accompanying steering dashboard.
Smart Process Monitor
For many entrepreneurs, their business processes are the foundation of successful entrepreneurship. Online, retail, transport, production, temporary employment and business services, every organization can distinguish itself with robust, reliable processes.
Smart Process Monitoring is at its core a technique, a tool, that makes it possible to see what is actually happening within the business processes of an organization. Our solution uses process mining technology. We take a number of “photos” and are placed one after the other by an algorithm, analyzed and can be easily viewed. Deviations and notable transactions are immediately visualized.