Training On The Job – Controllers & Financials

In the past years, much attention has been paid to data analysis, various studies have shown that data analysis has added value for the audit of the annual accounts.

These studies therefore also endorse that every controller or accountancy firm should use data analysis when auditing the annual accounts. Studies by the AFM shows that quality is being improved in small steps, but that the accountancy profession is still far from where it should be. The use of data analysis can contribute to improving the quality of statutory audits.

With Audit Analytics you are able to build analyzes that can be used for auditing the financial statements. The auditor will use these analyzes as audit evidence.

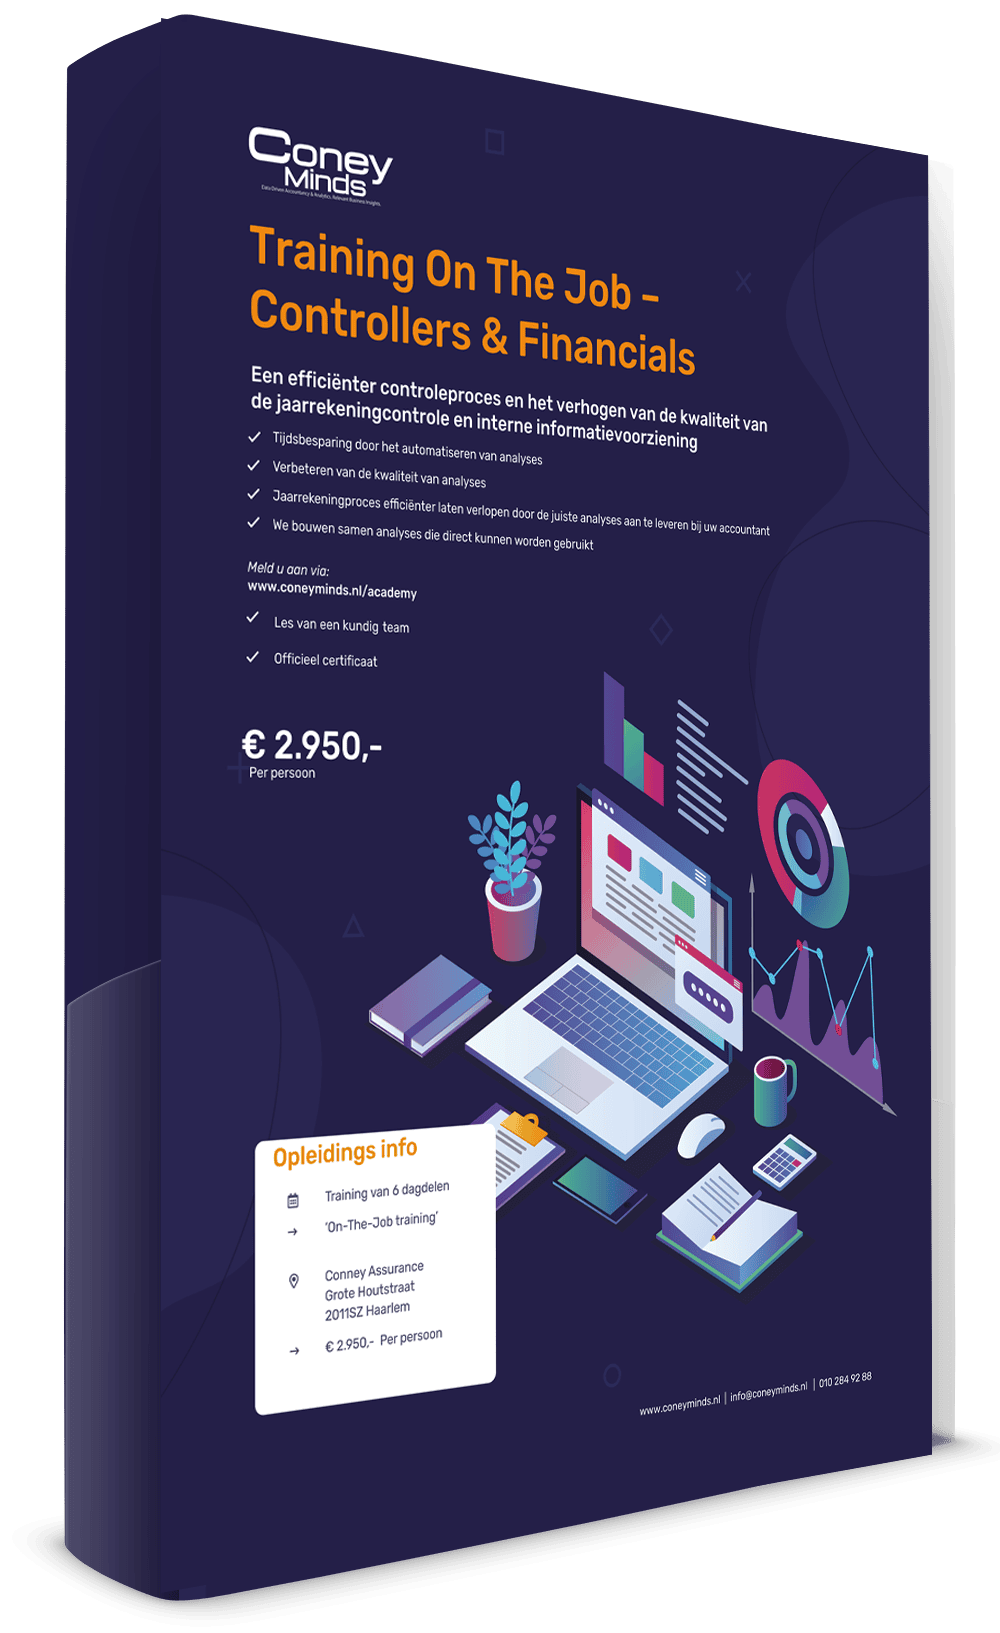
Training On The Job - Controllers & Financials

A more efficient audit process and increasing the quality of the annual audit and internal information provision

  • Time savings by automating analysis,
  • Improving the quality of analytics,
  • Make the annual accounts process run more efficiently by providing the correct analyzes to your accountant,
  • We build analytics together that can be used immediately.
View brochure

What to expect from the training?

1

Objective data analysis

During the first part of the day you will receive an explanation of the various tools that will be used for data analysis. Together we will see which datasets are available and determine which analyzes we can build in the upcoming days. After this day you will know which analysis we can build and what your advantage is.

2

Import, transform & analyze data

During part 2 and 3 you will get started with the ETL Tool and we will import your datasets. Then you will learn to use the most important node tools (standard scripts) to filter, select, sort, join, aggregate, export and validate data.

3

Building the data analysis

During day 4 and 5 we will start building an analysis that we named during the first half day. Depending on the complexity, several analyzes can be made.

4

Reporting and visualizing outcomes

During the last part of the day, we will start reporting the results and see how these results can be visualized. We then use the classification of outcomes and telling the story using a BI tool (Tableau or Power BI).

Other services